How to choose a copy trader: 7 numbers beyond the profit
By Fernando Funicelli · Founder of Lucky Dogs Trading Systems
To choose a copy trader, check their signal against 7 numbers before you copy it: growth without deposits, the maximum equity drawdown, the worst day, the month-by-month table, track record length and number of trades, the win rate next to the size of the losses, and position size. These numbers show whether a trader is good or just had a good stretch.
You open a list of signals and sort by the highest growth. The one at the top has a number that looks impossible: a few hundred percent in a few months. Next to it, the others look timid.
The urge is to copy exactly that one.
But the top of a profit ranking usually belongs to whoever risked the most in that period. And the ranking hides one detail: you don't copy the months that are already behind. You copy the next ones. Anyone who chooses by profit alone finds out about the risk when it is already in their own account.
The rule that fixes this fits in one sentence: on a signal, the number that matters most is not how much it made: it is how far it fell to make it.
If you are still working out how copying works, start with what copy trading is and how it works.
Before the numbers: where the signal's history comes from
A number is worth as much as its source. Before you look at any of them, check four things:
- A real account, not a demo. A demo shows the trader's rule, but not real execution: slippage, which is the difference between the price requested and the price filled, and the spread that widens at the moment of the news.
- Read straight from the broker. A screenshot is edited in a minute, and a spreadsheet is typed by hand. What counts is the history the broker recorded, without passing through anyone's hands.
- The whole history, from the first deposit. A new account in place of an old one erases the bad months without anyone having to lie.
- Proof that the history wasn't put together afterwards. A timestamp on every trade, recorded at the moment it happened.
These are the same demands we make of ourselves, in the 5 rules we use to publish every number. With the right source, the numbers tell you the rest.
How to evaluate a trading signal: the 7 numbers
Each number answers one question. Together, they tell the whole story of the signal: how much it made, what it cost to make it, and whether it can be repeated.
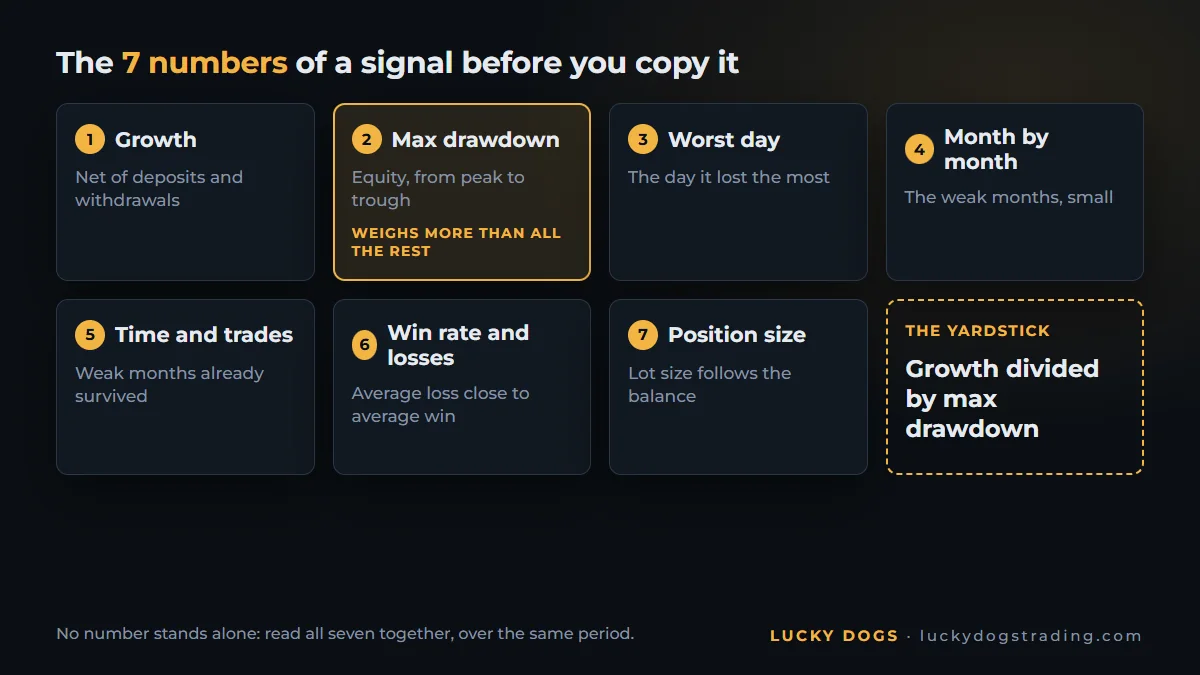
1. Growth, without deposits or withdrawals
The balance goes up when someone deposits. That is why the balance alone doesn't measure the trader. The right growth figure measures only what the trading did, with deposits and withdrawals left out of the account.
A deposit along the way can cover a loss and keep the curve rising. A large withdrawal shrinks the positions that follow and changes the pace of the history from then on.
The question: does the growth shown subtract deposits and withdrawals? If the curve jumps on the same day as a deposit, the answer is no.
2. The maximum equity drawdown
This is the main number of this guide. The maximum drawdown is the largest distance between an equity peak and the trough that came after it, as a percentage.
Note the word equity. The balance only changes when a position closes; equity also counts what is open. A trader who holds a losing position can show a balance rising smoothly while equity sinks.
With proportional copying, the signal's drawdown becomes your account's drawdown. So the question that decides is a personal one: could I watch my account fall that far without stopping the copy? Whoever stops at the bottom takes the whole loss and misses the recovery, if it comes.
The full topic, with examples, is in drawdown: what it is, balance or equity, and how much a robot falls.
3. The worst day
How much a single day has taken out of the account. The maximum drawdown shows the size of the hole; the worst day shows how fast it can open.
It is the number that tells you whether the trader has a brake. A small worst day, over a long history, belongs to someone who stops when the day goes badly. A worst day that wipes out weeks of gains shows that the brake doesn't exist.
If you are going to copy on a prop firm account, this is the number that talks to the firm's daily loss limit.
4. Month by month
The table of months answers two questions: how many months closed in profit and how big the weak months were.
The second weighs more. A year made in a single month is a bet: take that month away and nothing is left. Several average months, with small weak months, is a rule at work.
The month in progress counts as partial: a good start to the month is not yet a good month.
5. Track record length and number of trades
With few trades, luck and rule get mixed up. A short run of wins happens by chance; with hundreds of trades, chance weighs much less.
With few months, the signal may not yet have been through a bad market for its style.
There is no magic number of months or trades. The criterion is different: the more weak months the signal has already been through, the more the history says. A short history with huge gains calls for more explanation than a long history with modest gains.
6. The win rate, next to the size of the losses
The win rate, the percentage of trades in profit, is the number that attracts the most and misleads the most when it appears alone. The calculation that matters fits on one line:
win rate × average win − loss rate × average loss
An example, only to show the math: 90% win rate, an average win of 10 USD and an average loss of 120 USD.
0.9 × 10 − 0.1 × 120 = 9 − 12 = −3 USD per trade.
The signal wins almost every time and loses money. A very high win rate with rare, huge losses is the design of martingale, which postpones the loss by doubling the lot. The full math is in martingale in trading: what it is and why it blows up one day.
What you are looking for is an average loss the size of the average win, or smaller. With the two equal, any win rate above 50% already closes positive, before costs.
7. Position size relative to the account
The lot, the volume of each trade, compared with the account balance at that moment. Two designs look the same from a distance and are opposites:
- A lot that grows together with the balance is compounding: the trader risks the same slice of a larger account.
- A lot that grows after a loss is forced recovery: the trader tries to win everything back at once.
The second is the clearest sign of risk hidden in a history. Look at the volume of the trades right after losses, and at how long the losing positions stay open: a position in the red that stays open for days is a loss that just hasn't been closed.
How to know if a trader is good: the reading table
The 7 numbers in one table, to apply to any signal. The last column doesn't say the trader is bad: it says when the number calls for an explanation before you copy.
| Number | Where to look | What to look for | Calls for an explanation when |
|---|---|---|---|
| Growth | the account curve | that it subtracts deposits and withdrawals | the curve rises together with a deposit |
| Max drawdown | equity, from peak to trough | a drop you could sit through | equity falls far below the balance |
| Worst day | the day of the biggest loss | a visible brake | one day wipes out weeks |
| Month by month | the table of months | small weak months | the whole year came from one month |
| Time and trades | since when, how many trades | weak months already survived | short history with huge gains |
| Win rate and losses | the win rate, average win and average loss | average loss the size of the average win | very high win rate with a much larger average loss |
| Position size | the volume of each trade | a lot that follows the balance | a lot that rises after a loss |
A number that calls for an explanation doesn't eliminate the signal. It eliminates the signal that doesn't explain.
How to choose the best copy trader for you: compare two signals
Two rules are enough to compare signals fairly.
Compare over the same period. One year of one signal against three months of another is not a comparison: the year has been through more markets.
Use a simple yardstick: growth ÷ max drawdown. It says how much the signal made for each point it fell. The higher it is, the less drawdown the growth cost.
Take two example signals, which are not real signals:
| Over the same 6 months | Signal A | Signal B |
|---|---|---|
| Growth | +120% | +60% |
| Max equity drawdown | 48% | 12% |
| Growth ÷ drawdown | 2.5 | 5.0 |
| Months in profit | 3 of 6 | 5 of 6 |
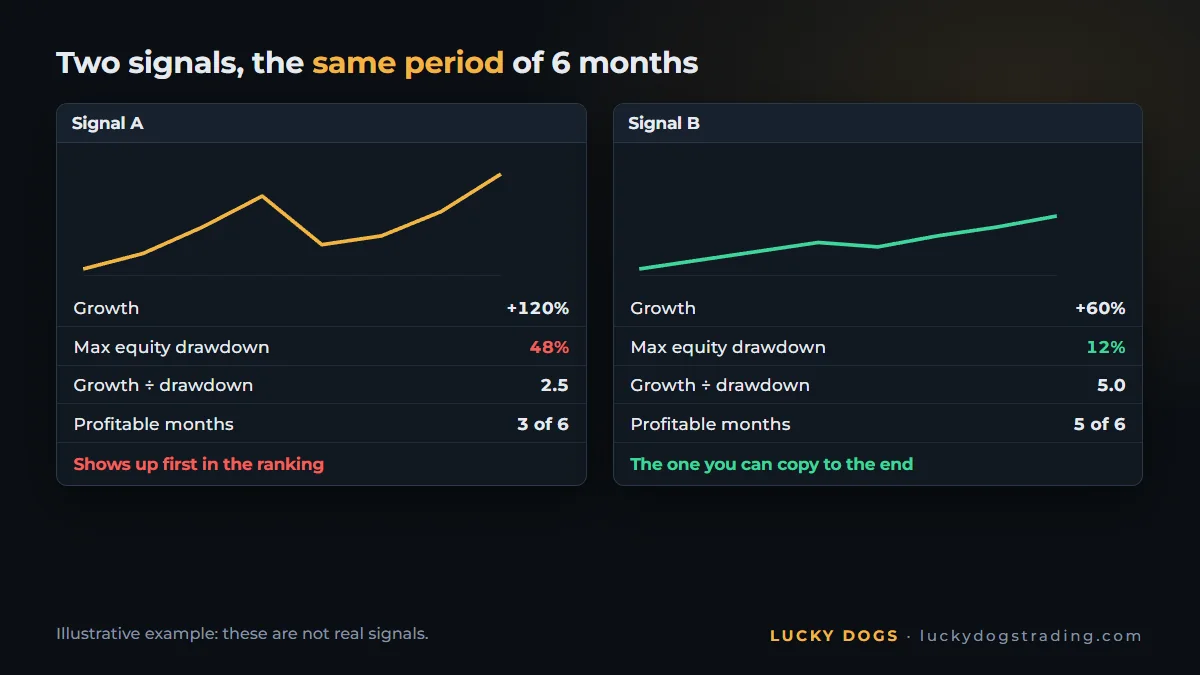
A made twice as much. To do it, it fell four times as far and closed only half the months in profit. A shows up first in the ranking. B is the one you can copy to the end.
That is why "the best copy trader" doesn't exist for everyone. What exists is the signal that passes the 7 numbers with a drawdown that you can stand.
How much of your account to put into the copy
Once you have chosen the signal, you need the size. With proportional copying, the signal's drawdown becomes your copy's drawdown, in the same percentage. So choose the amount backwards: start from the dollar loss you accept seeing on screen.
| You copy with | Signal with 12% drawdown | Signal with 30% drawdown | Signal with 48% drawdown |
|---|---|---|---|
| 1,000 USD | −120 USD | −300 USD | −480 USD |
| 5,000 USD | −600 USD | −1,500 USD | −2,400 USD |
In practice: if you don't want to see more than 600 USD in the red, a signal with a 12% drawdown fits with 5,000 USD. A signal with a 48% drawdown fits only with about 1,250 USD. And leave some margin: whoever sizes with room to spare gets through the next drawdown without touching the copy.
An account that is too small has another limit, the minimum lot: below a certain size, the copy can't follow in the same proportion. The math is in the size of the copy: proportional to your account.
From 100 to 100K: the 7 numbers on one scoreboard
Everything this guide asks of a signal, From 100 to 100K shows in public.
It is a gold signal, traded by hand by a trader, on a real account at Hantec. The account started with 100 USD on October 13, 2026, and the goal is to reach 100,000 USD. The scoreboard reads the account straight from the broker, and every closed trade goes in there, with the whole history from the first deposit.
Each number in this guide has a place on the scoreboard:
| The number | Where it is on the scoreboard |
|---|---|
| The source | "Real account", the broker and the deposits next to the balance, from the start |
| 1. Growth | "Growth"; on the curve, deposits and withdrawals count neither as profit nor as drawdown |
| 2. Max drawdown | "Largest drop" and the "Equity drops from the peak" chart |
| 3. Worst day | "Worst day" |
| 4. Month by month | "Month by month", with the month in progress marked |
| 5. Time and trades | the start date, "Trades" and the periods, from 7 days to "All" |
| 6. Win rate | the win rate and the net profit, next to the trades |
| 7. Position size | the volume of each trade, in the data of each timestamp |
Two things make the scoreboard proof, not a showcase:
- The timestamp on every trade. Since October 26, 2026, every trade gets a timestamp at entry and at exit: a number, a time and a unique code (a hash), which OpenTimestamps records on Bitcoin. Changing one trade changes its timestamp and that of every trade after it.
- The 1-hour delay. The scoreboard shows each trade 1 hour after it closes, with the asset, the price, the volume and the broker's time.
By number 5, a new history is still being written. The difference is that, here, you see each line go in and you don't have to trust any month you didn't see.
The numbers change every day, so they are not in this guide: they are there. Check the 7 numbers on the From 100 to 100K scoreboard and run the signal through the reading table yourself.
Frequently asked questions
Who is the best copy trader?
There isn't one for everyone. There is the one that passes the 7 numbers with a drawdown you can stand to see in your account. To compare candidates, use the same period and the growth ÷ max drawdown yardstick.
How much drawdown is acceptable on a signal?
There isn't one number that suits everyone. What is acceptable is the drop you could watch in your account, in dollars, without stopping the copy. And always compare it with the growth: a 30% drawdown to grow 30% costs far more than the same drawdown to grow 300%.
How long a track record should a signal have?
There is no minimum that holds for everyone. What counts is that the signal has already been through weak months and a bad market for its style. A short history with huge gains calls for an explanation.
Is a signal with a high win rate good?
Only if the average loss is the size of the average win, or smaller. With a 90% win rate and losses twelve times larger than the wins, the math closes negative. A very high win rate with rare, huge losses is the design of martingale.
Does a signal on a demo account count?
It counts for getting to know the trader's rule, not for measuring execution: a demo doesn't show real slippage or the spread during news. To copy with real money, prefer a real account, read straight from the broker.
Is copy trading reliable?
It is as reliable as what you check before copying: the source of the history, the 7 numbers and the money in your account, in your name. The criteria are the ones in this guide, and the "Where the signal's history comes from" section is the place to start.
Choosing who to copy is choosing the drawdown you accept. Start with the scoreboard that keeps the 7 numbers in plain view: follow From 100 to 100K, trade by trade, from the start.
Prefer a rule you can test yourself, before you pay? The same numbers apply to our gold EAs: every page shows the maximum drawdown next to the gain, in the real-tick test, and the free demo runs in your MetaTrader. See our gold EAs, side by side.